HeatSense web app
Arizona heat guidance on work and rest, from a synthetic sensor model.
Limit: The current deployment runs on a labelled synthetic sensor model.
- Role
Full-Stack Developer (AI-Assisted) & Technical Writer
- Status
Deployed decision surface. Live FortyGuard data needs the proxy backend running; otherwise labelled synthetic telemetry is used.
- Stack





The problem
A raw temperature reading does not tell a site manager what to do. Heat risk depends on humidity, wet-bulb globe temperature, urban heat-island effects and how conditions will move over the next hour. The useful output is a directive with a duration attached, not a number.
What I built
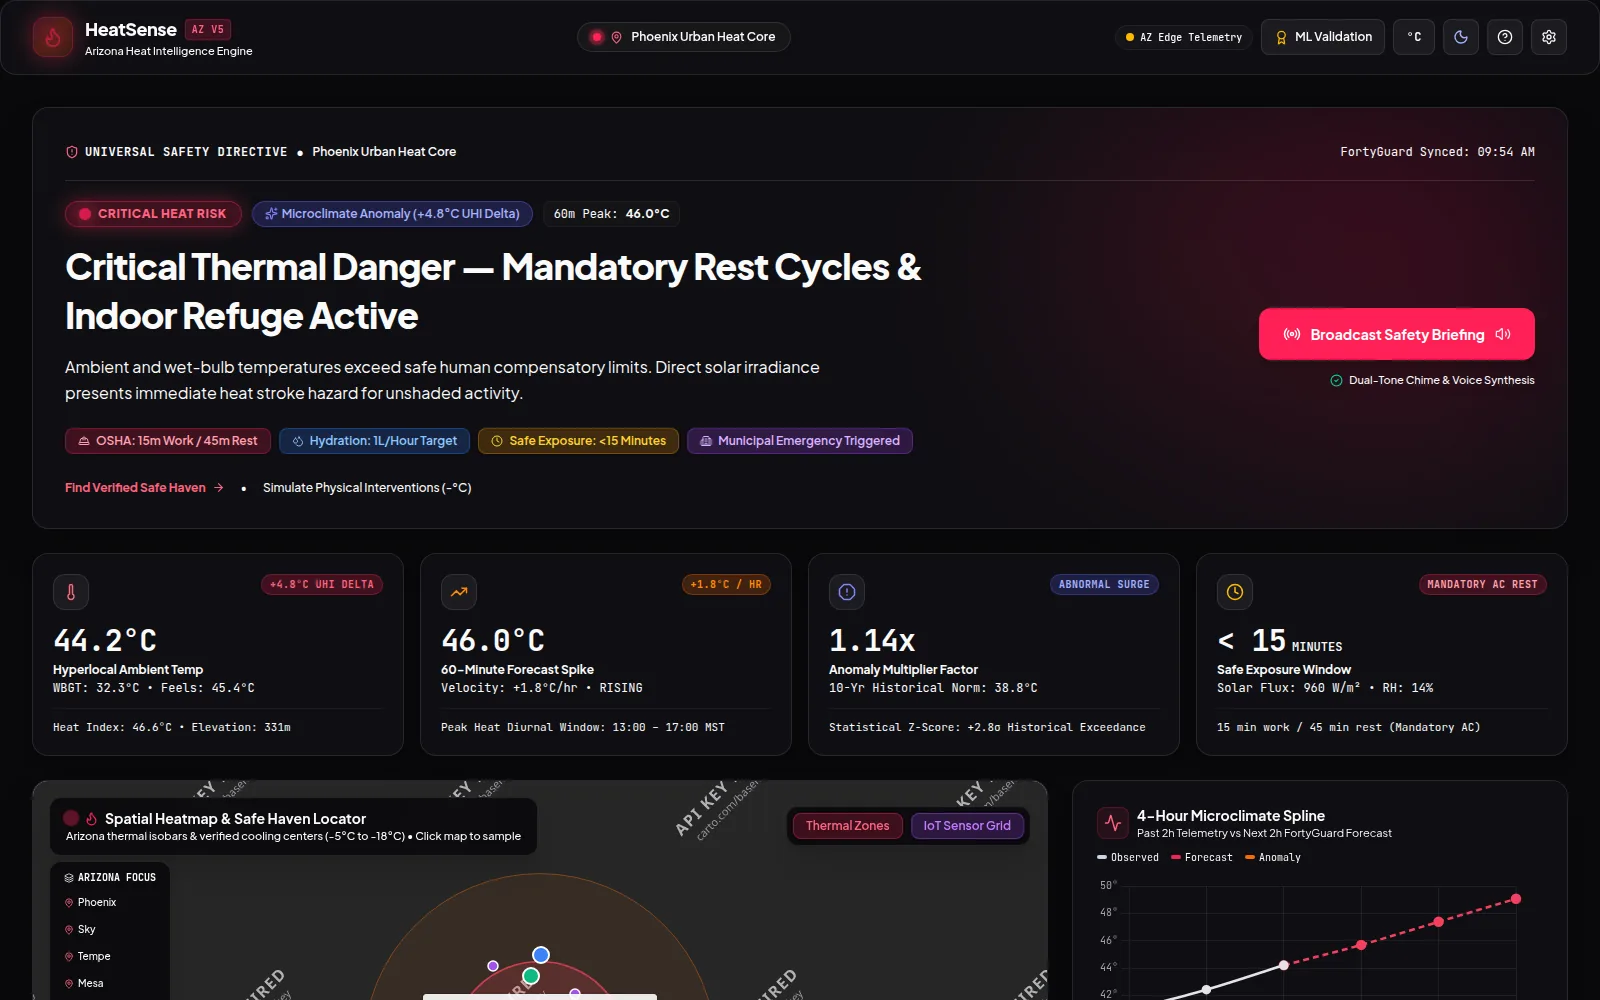
I iterated the product three times before the current build. V2 was a Lovable-built command center with Mapbox and five operational personas; V4 added a real Express backend proxying the FortyGuard API with a fifteen-minute cache, plus a PWA service worker. V5 is the consolidation: one coherent engine. Across all three I mapped the FortyGuard surface (environmental parameters, heat intelligence, satellite pass, street environment) onto the decisions a field supervisor actually has to make.
- React 19 + Vite + TypeScript + Tailwind CSS interface, deployed as a static build.
- Four-endpoint FortyGuard pipeline — environmental parameters, heat intelligence, satellite, and status polling — behind one API service module.
- Leaflet isobar heat map with a safe-haven locator and click-to-sample thermal zones.
- Four-hour microclimate forecast chart comparing observed telemetry against the next two hours, with an anomaly multiplier and trend velocity.
- WBGT, urban heat-island delta, and a SHAP-style explainability panel breaking the risk call into its contributing factors.
- Simulator bar for testing interventions, plus a visual-validation modal and settings for the data source.
- V4 additionally shipped an Express proxy backend with caching and a service worker for offline resilience.
The result
A live, dense decision surface: the operator sees the current directive, the numbers behind it, the forecast, and a map with safe locations — and in the V4 line, a real backend and cache rather than a mocked data layer. Deployments and source are linked below.
What it does not do
The V5 deployment ships only the static front end, so with no proxy backend live the engine falls back to a clearly labelled synthetic Arizona edge-telemetry model rather than live FortyGuard data; the repository README is still the Vite template; and the earlier V4 sub-apps (a Next.js variant and an untouched starter scaffold) remain in the tree as unfinished work.